Paper Engine
ExperimentBoard Game Mechanics Recommendation
Library of data visualization technic and pattern that ready to use
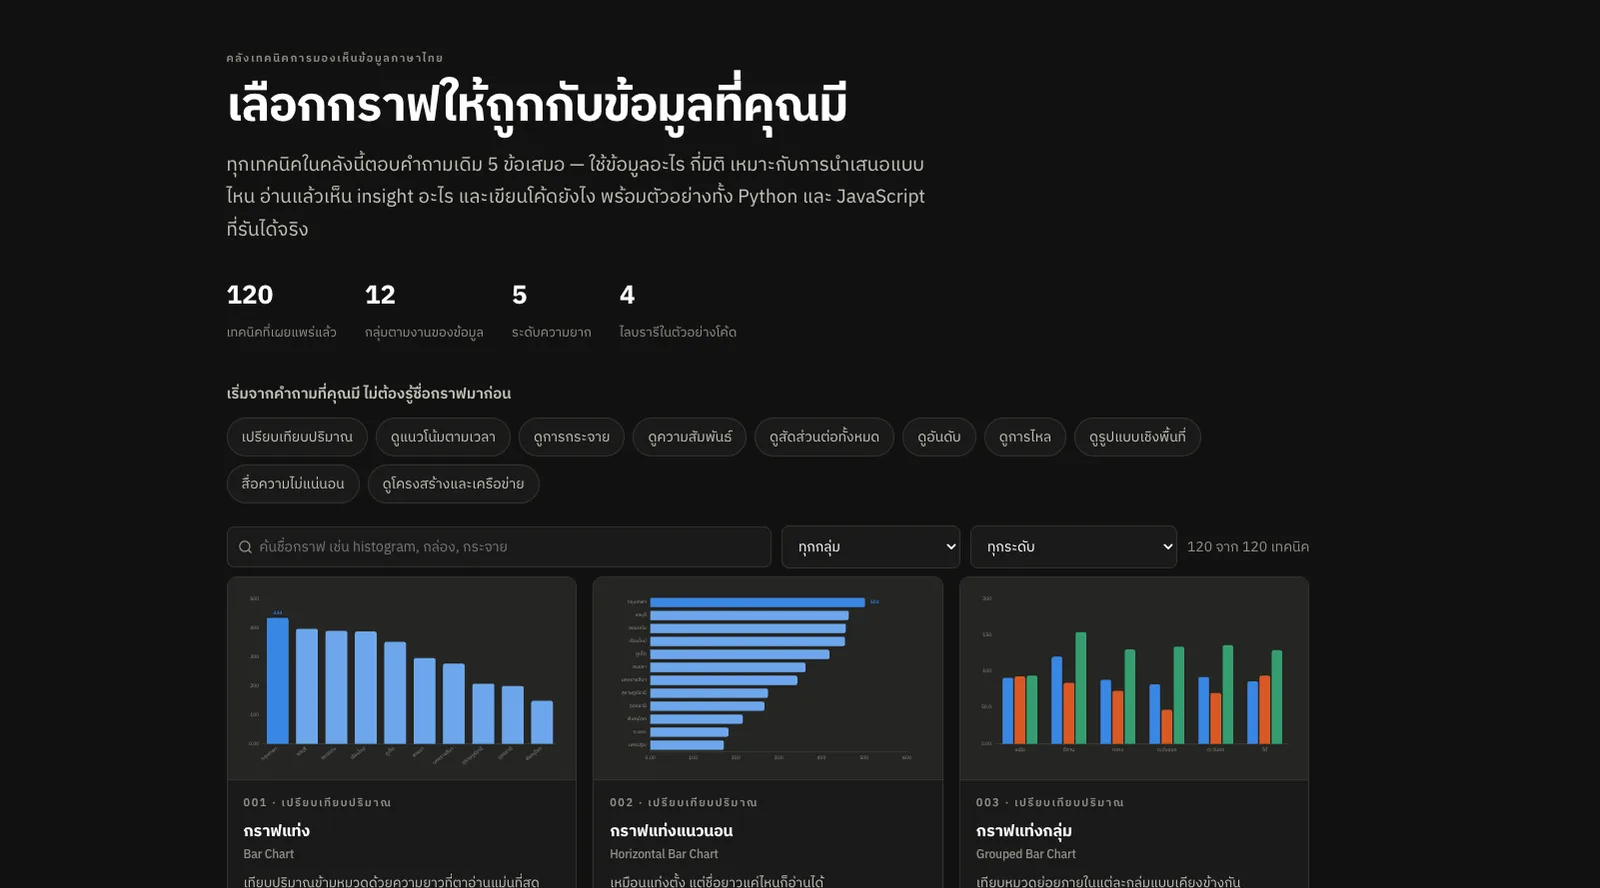
Data Visualize Library is less a gallery of charts and more a library of "ways to tell a story with data".
When we have data in hand, we usually start by asking what chart should this be? and end up cycling through the same few: Bar, Line, Pie, Scatter. This site flips that around. You do not need to know a chart's name first — only what you want to see in the data: compare amounts, follow a trend, look at a distribution, find a relationship, show proportions or trace a flow. Then you find the method that fits.
Inside are 120 techniques, grouped by what the data needs to do. Each one covers how to shape the data, how many variables it takes, what size of data suits it, what a reader should see — and also what that chart cannot answer, and the mistakes to watch for.
It tries to explain charts in plain language. A Bar Chart is not just "for comparing values": it explains why our eyes read it easily, when to switch to something else, and how a badly cut axis can mislead you — with examples and code you can actually reuse.
Beyond being a library, it works like an assistant for choosing a chart. Tell it roughly how much data you have and whether it is for slides, a report, a dashboard or a general audience, and it suggests a fit — or puts two or three charts side by side to show what each does well and where each falls short.
It is also a "don't-get-it-wrong" guide for anyone making data visualizations, collecting the common traps: bars that do not start at zero, pie charts with too many slices, 3D charts, rainbow colors, and seeing a correlation and jumping to cause and effect — with why each is wrong and what to do instead.